
COVID-19 Germany local incidence and ICU occupancy (in German)
- Dashboard Heroku App - Twitter bot @corona7tage All data is based on the official APIs by RKI dashboard and DIVI
- Dashboard Heroku App - Twitter bot @corona7tage All data is based on the official APIs by RKI dashboard and DIVI
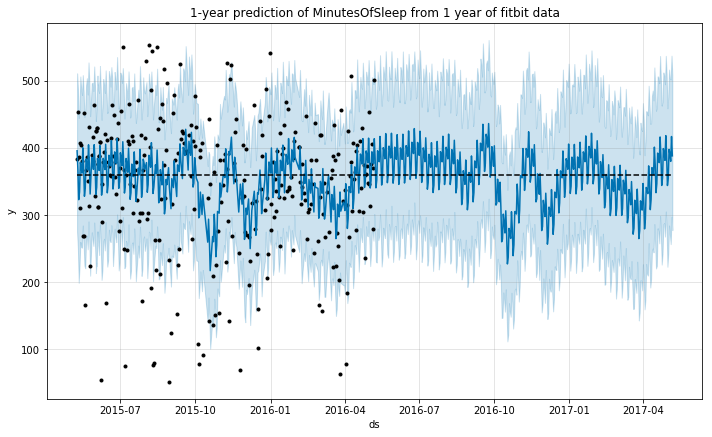
The goal of this notebook is to provide an analysis of the time-series data from a user of a fitbit tracker throughout a year. I will use this data to predict an additional year of the life of the user using Generalized Additive Models. Data source: Activity, Sleep Packages used: pandas, numpy, matplotlib, seaborn Prophet import pandas as pd import numpy as np from fbprophet import Prophet import matplotlib.pyplot as plt import seaborn as sns %matplotlib inline Data cleaning (missing data and outliers) # import the activity data activity = pd.read_csv('OneYearFitBitData.csv') # change commas to dots activity.iloc[:,1:] = activity.iloc[:,1:].applymap(lambda x: float(str(x).replace(',','.'))) # change column names to English activity.columns = ['Date', 'BurnedCalories', 'Steps', 'Distance', 'Floors', 'SedentaryMinutes', 'LightMinutes', 'ModerateMinutes', 'IntenseMinutes', 'IntenseActivityCalories'] # import the sleep data sleep = pd.read_csv('OneYearFitBitDataSleep.csv') # check the size of the dataframes activity.shape, sleep.shape # merge dataframes data = pd.merge(activity, sleep, how='outer', on='Date') # parse date into correct format data['Date'] = pd.to_datetime(data['Date'], format='%d-%m-%Y') # correct units for Calories and Steps for c in ['BurnedCalories', 'Steps', 'IntenseActivityCalories']: data[c] = data[c]*1000 Once imported, we should check for any missing data: ...
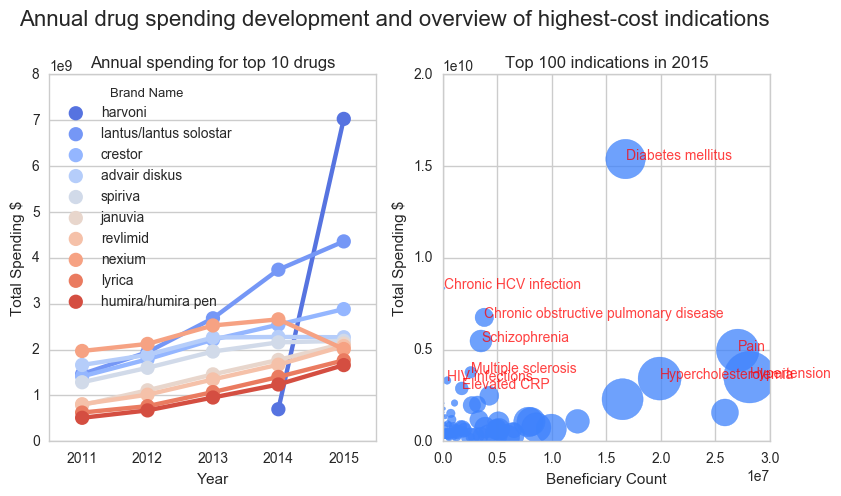
Health care systems world-wide are under pressure due to the high costs associated with disease. Now more than ever, particularly in developed countries, we have access to the latest advancements in medicine. This contrasts with the challenge of making those treatments available to as many patients as possible. It is imperative to find ways maximize the positive impact on the quality of life of patients, while maintaining a sustainable health care system. For this purpose I performed an analysis of Medicare data in the USA. Furthermore I used a drug-disease open database to cluster the costs by disease. I identified the most expensive diseases (mostly chronic diseases such as Diabetes) and the most expensive medicines. A drug for the treatment of HCV infections (Harvoni) stands out with the highest total costs in 2015. After this first exploration, I propose the in-depth analysis of further data to enable more targeted conclusions and recommendations to improve health care, such as linking of price databases to compare drug costs for the similar indications or the analysis of population data registers that document life style characteristics of healthy and sick individuals to identify those at risk of developing high-cost diseases. ...
Do movie releases produce literal earthquakes? We always hear about new movie releases being a “blast”, some sure are. But how do two independent events correlate with each other? In this post, I will use Python to visualize two different series of events, plotting them on top of each other to gain insights from time series data. # Imports from datetime import datetime import numpy as np import pandas as pd import matplotlib.pyplot as plt import seaborn as sns sns.set_palette('Set2') sns.set_style("whitegrid") %matplotlib inline Getting the data To make this example more fun, I decided to use two independent series of events for which data is readily available in the internet: ...
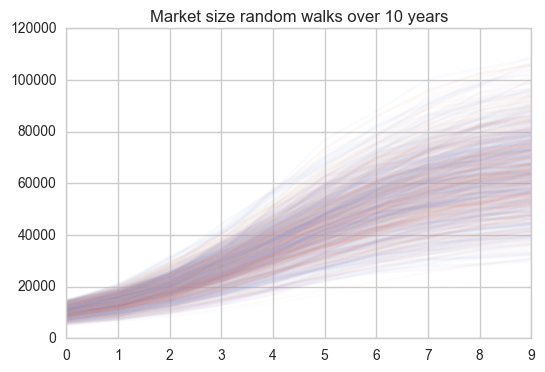
Being able to see the future would be a great superpower (or so one would think). Luckily, it is already possible to model the future using Python to gain insights into a number of problems from many different areas. In marketing, being able to model how successful a new product will be, would be of great use. In this post, I will take a look at how we can model the future revenue of a product by making certain assumptions and running a Monte Carlo Markov Chain simulation. ...